Google Analytics 4 shows you what happened. BehavFlow adds the missing layer by visualizing the real behavior and paths across your entire site, web app or e-commerce store.
From entry to conversion and everything in between.
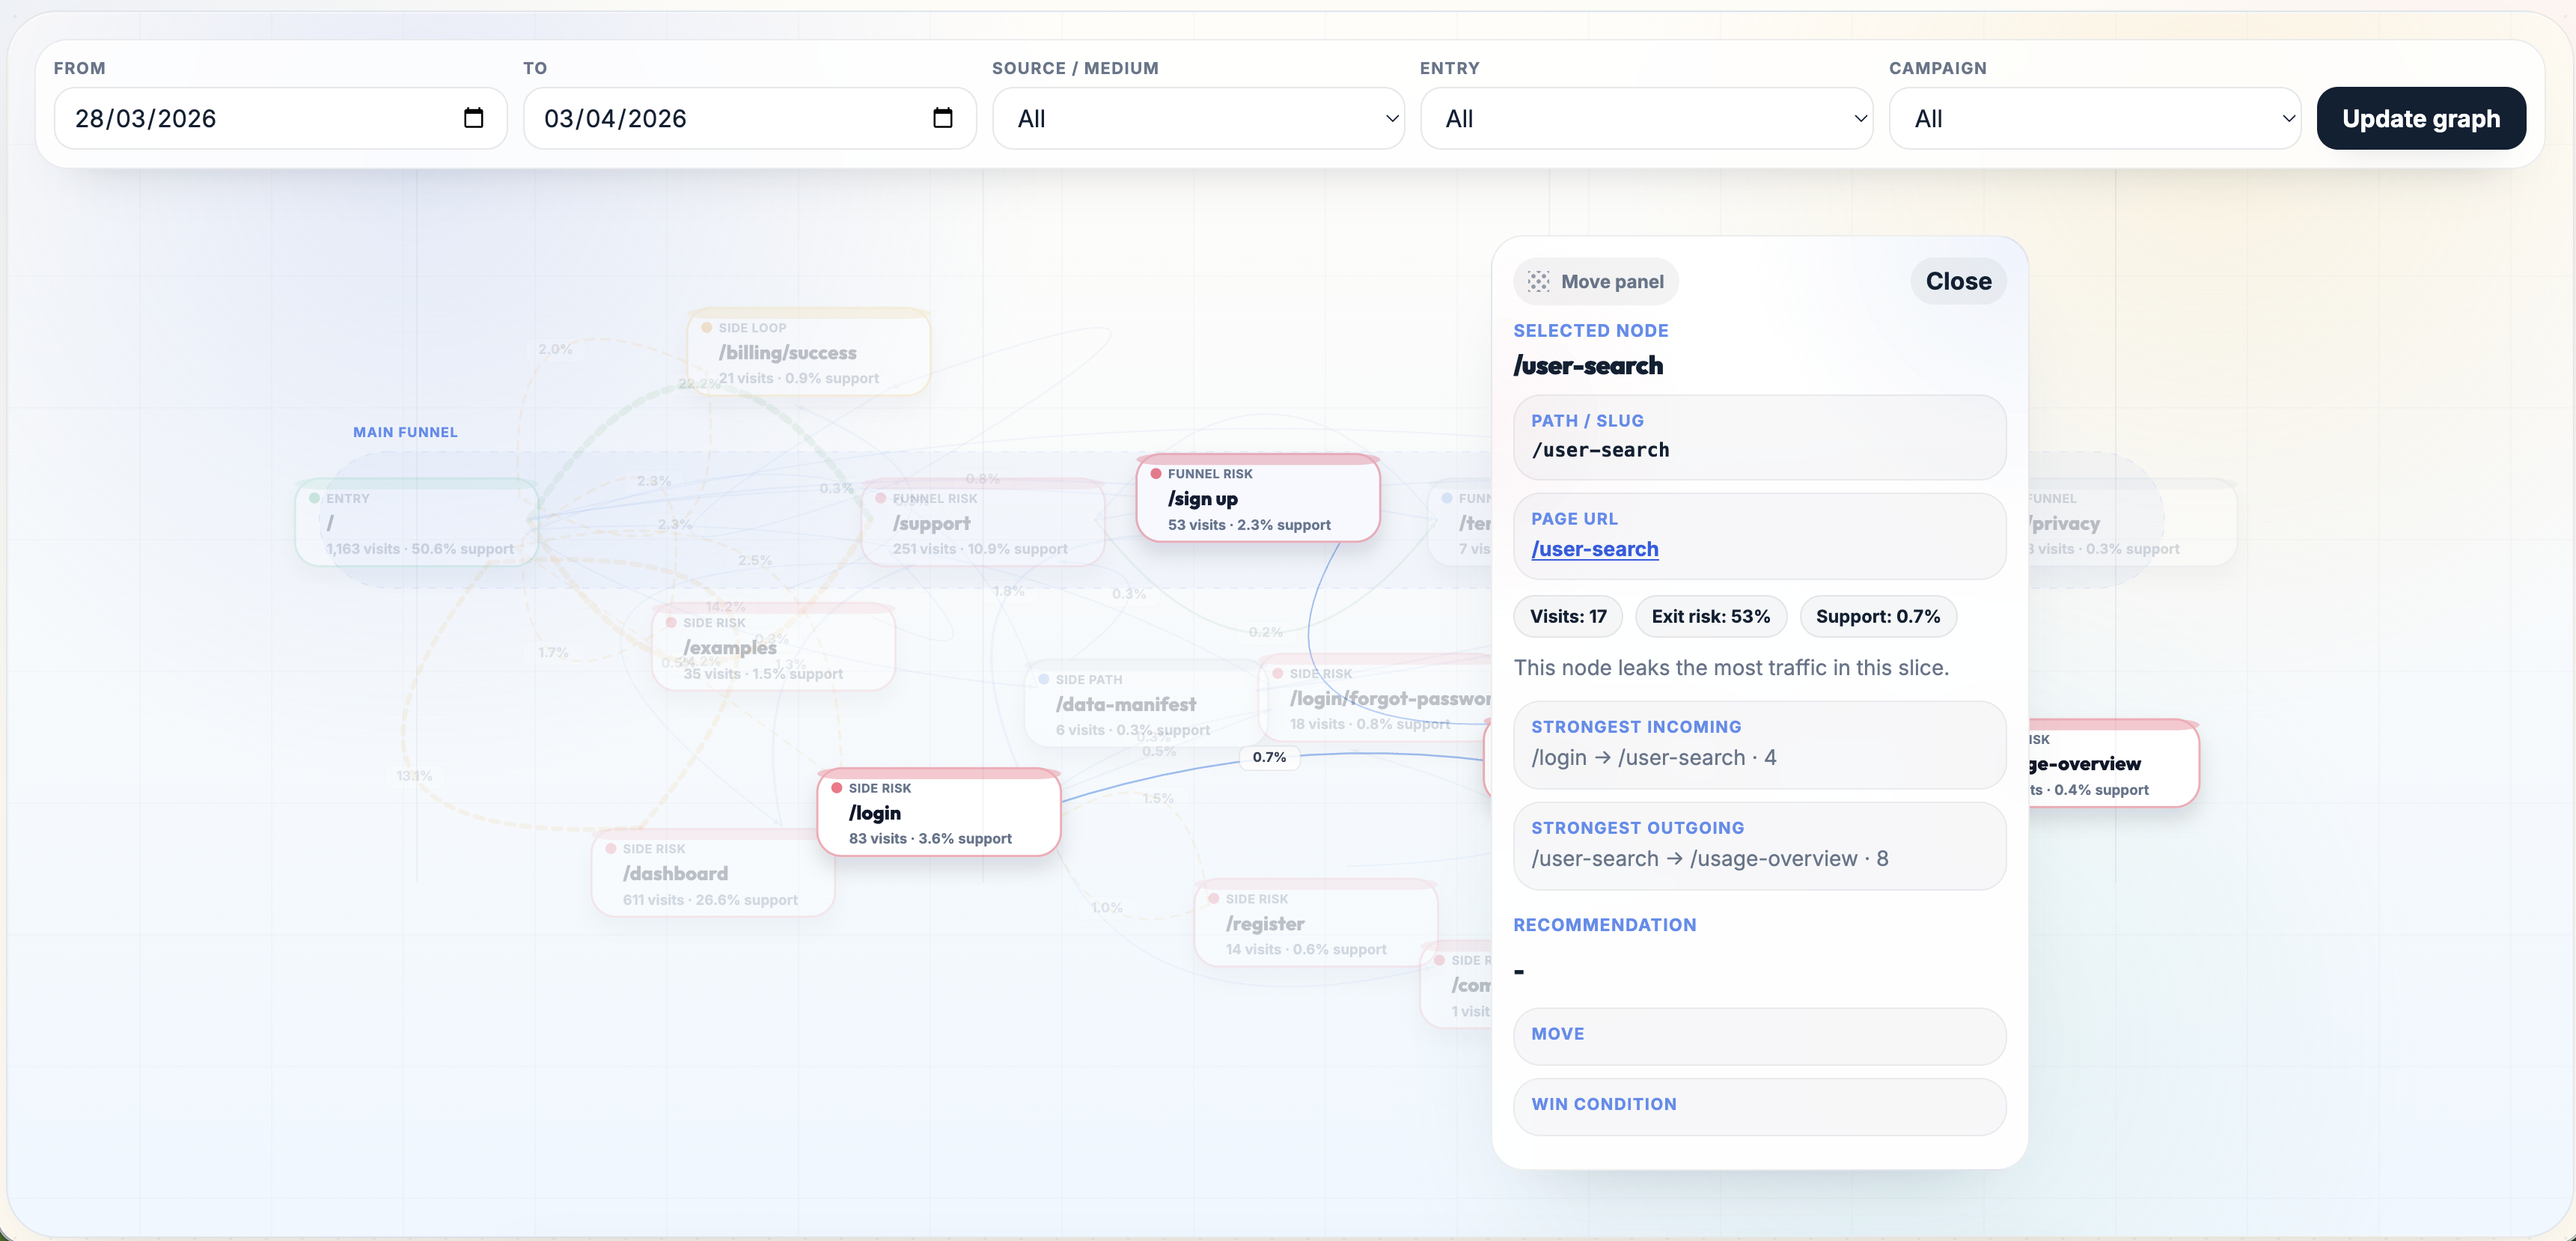
Users navigate step by step, exploring, comparing, backtracking, deciding.
BehavFlow makes that visible alongside your GA4 metrics.
Import your existing Google Analytics 4 data. No tagging or setup required.
We rebuild navigation paths across sessions seamlessly alongside your data.
Sessions are grouped into:
Clear patterns in how people browse
across thousands of sessions.
BehavFlow helps you:
Make decisions based on how users actually move.
Connect your Google Analytics 4 and explore real user navigation and browsing patterns in minutes.
Setup in 2 minutes · Cancel anytime